Mutexes or mutual exclusion algorithms are lighter and more granular concurrency mechanism than latches and are used in concurrent programming to avoid the simultaneous use of a common resource.
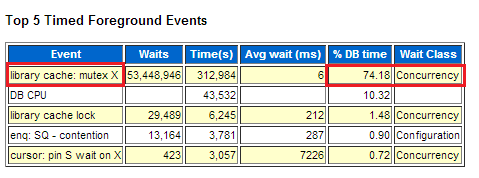
Oracle started using mutexes from 10g for certain operations in the library cache but from 11g all library cache latches were replaced by mutexes which lead to the common to all DBAs “library cache: mutex X” concurrency event:
The irony here is that the reason for obtaining a mutex is to ensure that certain operations are properly managed for concurrency but the management itself leads to concurrency. These are the top 3 differences between mutexes and latches:
– A mutex can protect a single structure, latches often protect many structures
– A mutex get is about 30-35 instructions in the algorithm, compared to 150-200 instructions for a latch get
– A mutex is around 16 bytes in size, compared to 112-200 bytes for a latch
Last month, I found a very interesting and detailed article by Anju Garg on latches and mutexes. It is worth reading.
The aim of this post is to suggest on how to proceeded if you hit the “library cache: mutex X” concurrency event which simply means that a library cache operation is being performed and Oracle is trying to get the library cache mutex in eXclusive mode.
Do the following:
1. Run a query against the x$kglob table to find the names of the objects being pinned most of the time. x$kglob is the resource structure table for library cache locks and pins. Jagjeet’s note gives a very good example.
select * from (
 select case when (kglhdadr = kglhdpar) then 'Parent' else 'Child '||kglobt09 end cursor,
 kglhdadr ADDRESS, substr(kglnaobj,1,20) NAME, kglnahsh HASH_VALUE, kglobtyd TYPE,
 kglobt23 LOCKED_TOTAL, kglobt24 PINNED_TOTAL,kglhdexc EXECUTIONS, kglhdnsp NAMESPACE
 from x$kglob -- where kglobtyd != 'CURSOR'
order by kglobt24 desc)
where rownum <= 20;
2. If you have issues with PL/SQL packages and procedures, use dbms_shared_pool.markhot() to mark them as hot. As suggested by Andrey Nikolaev, Oracle creates multiple copies of marked objects in the library cache, but frequently uses only one of them. That is why, in order to achieve uniform distribution, mark the PL/SQL objects as hot immediately after the instance restart.
The documentation for the dbms_shared_pool.markhot procedure can be found here.
3. If the issue is sequence related, then either verify with Oracle that it is not a bug, get rid of the sequence if possible or at least modify its parameters (cache, order, etc.).
As you can see from Dom Brook’s article, issues are often package related. Have a look at my screenshot from ASH. The data source is V$ACTIVE_SESSION_HISTORY.
You may review on Metalink “Waitevent: library cache: mutex X” (Document ID 727400.1) for the list of known Oracle bugs but for all I have seen, sometimes patches do not help, so finding a workaround is all the DBA is left with. An ASH report will be very helpful:
If you see “library cache: mutex X” as a top event, note that ADDM will first find that there is contention for latches related to the shared pool that were consuming significant
database time (no surprise). For the top SQL statements, ADDM will claim something like “Waiting for event library cache: mutex X in wait class ‘Concurrency’ accounted for 97% of the database time spent in processing the SQL statement with SQL_ID d2svmdafangyq.” Look then at the “Rationale” sections and hunt for the names of the PL/SQL packages 🙂


