Douglas Adams, the author of “The Hitchhiker’s Guide to the Galaxy” said: “A common mistake that people make when trying to design something completely foolproof is to underestimate the ingenuity of complete fools”.
I am talking here about Oracle’s Cost Based Optimizer.
The optimizer needs to make decisions about execution plans in a very short time: not all execution plans can be scanned. Staring Oracle 10g, Oracle allows the optimizer to run in tuning mode where it can gather additional information and make recommendations about how specific statements can be tuned further.
Funny thing here is that we rely on the same component (CBO) to improve the SQL statement that could not generate an optimal plan in the first place.
In this post, I would like to show something about Oracle 11gR2 that cannot be found either on Google or on Metalink. It is about tracing the SQL Tuning Advisor.
A very good review of what STA does was written by Tim Hall. Worth checking is also what Kerry Osborne writes about SQL Profiles. Cool stuff!
Christian Antognini’s article on SQL Profiles and how to trace it is probably the best written on that subject. Using the undocumented parameter _STN_TRACE, it is possible to trace what is happening during the SQL Tuning Advisor performance analysis. I find slight amusing the choice of the name of the domain used for Oracle FAQ but I guess this is not intentional.
However, if you check Jonathan Lewis’s article on SQL Profiles and the comments after it, you will notice that: _stn_trace does not seem to be available anymore in 11gR2″. That is visible from the _STN_TRACE documentation available on Oracle FAQ.
Starting 11gR2, there is an event trace[sql_manage.*] disk=low. Disk can be set to one of these 3 values: low, medium, or highest. The ora_debug_table is no longer needed or used.
You can set the event either at session or system level. If using OEM, then set it at system level, just like this:
alter system set events 'trace[sql_manage.*] disk=highest';
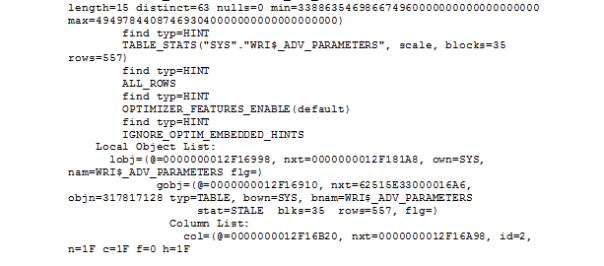
Once you run the SQL Tuning Advisor, go to either user_dump_dest or diagnostic_dest/diag/rdbms/SID/trace. You will find a long text file containing all analysis performed by STA.
The screenshot on the top of this post shows you the alternative execution plan offered by the SQL Tuning Advisor, the one below shows you the recommendations:
The trace file generated because of enabling STA tracing on the highest level is way too big (20MB) but I am anyway posting it here.
This is twenty megabytes of text fitting into 8670 pages for what Oracle does for a single SQL statement!


